

;)
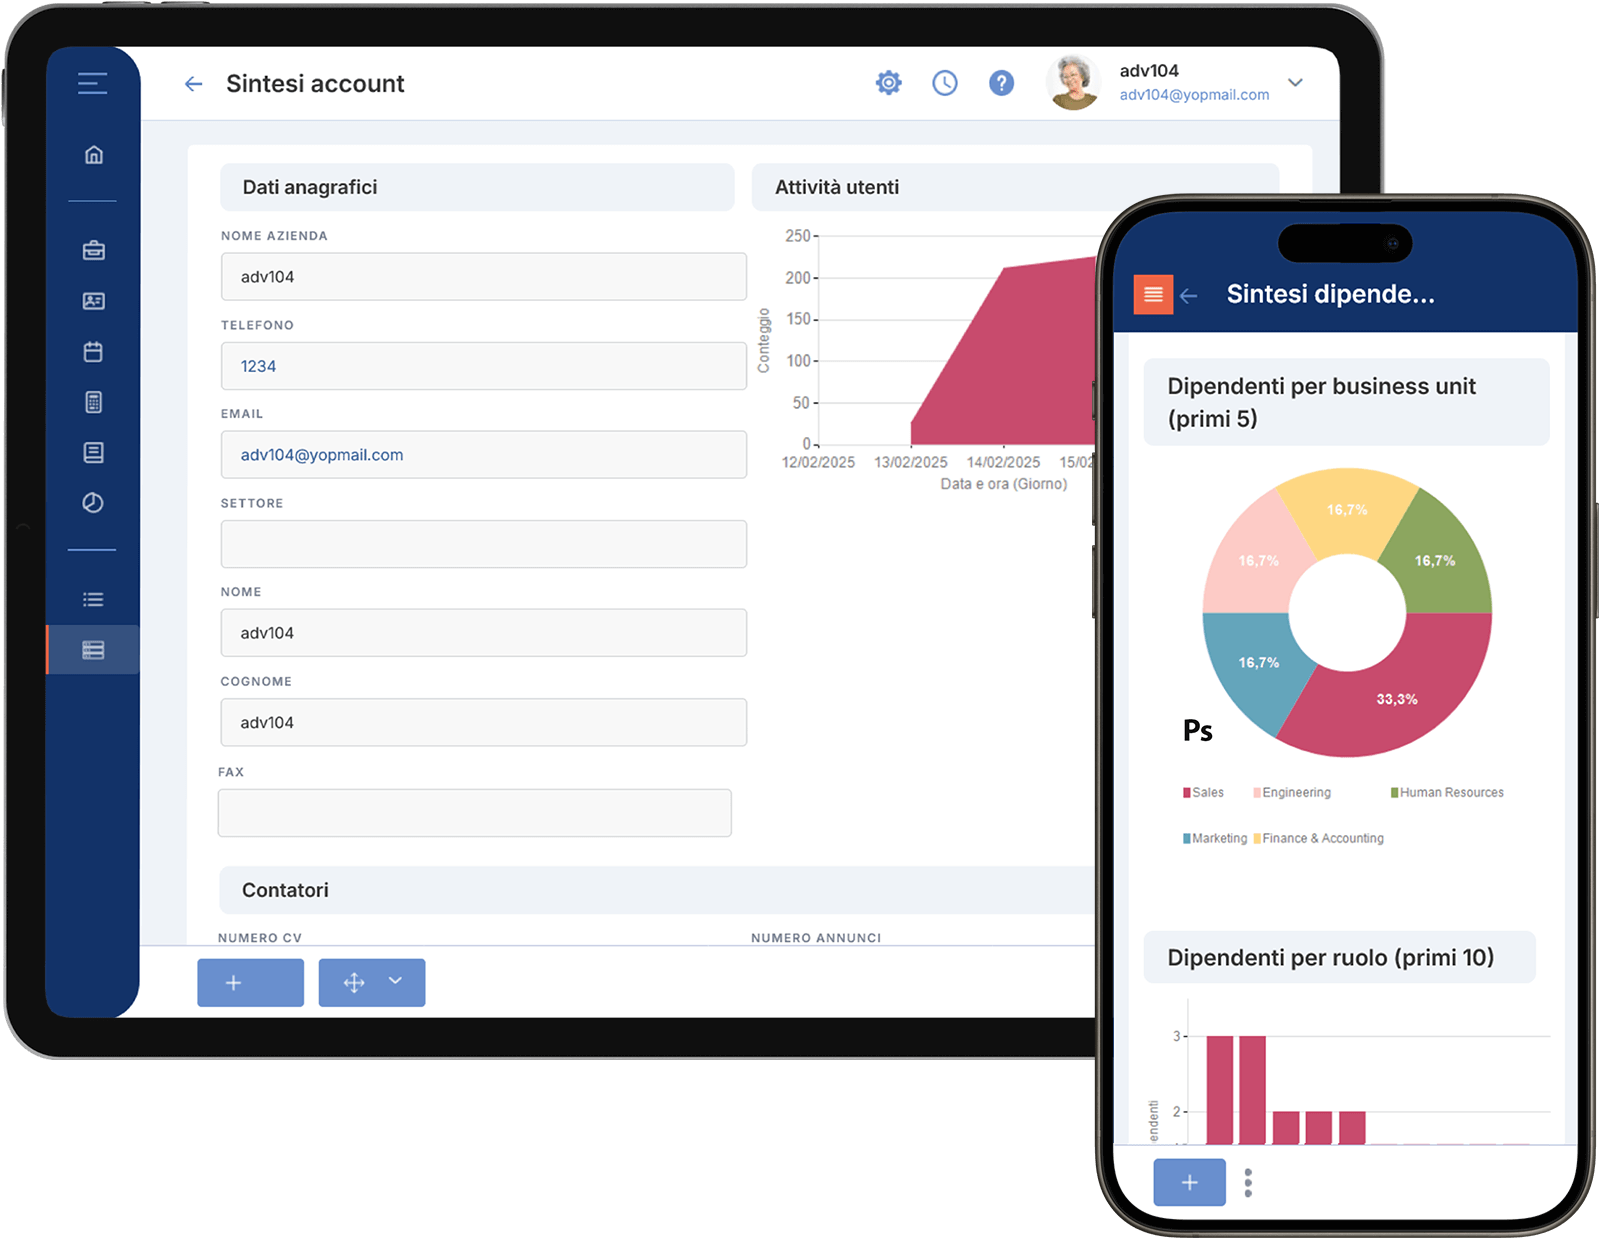
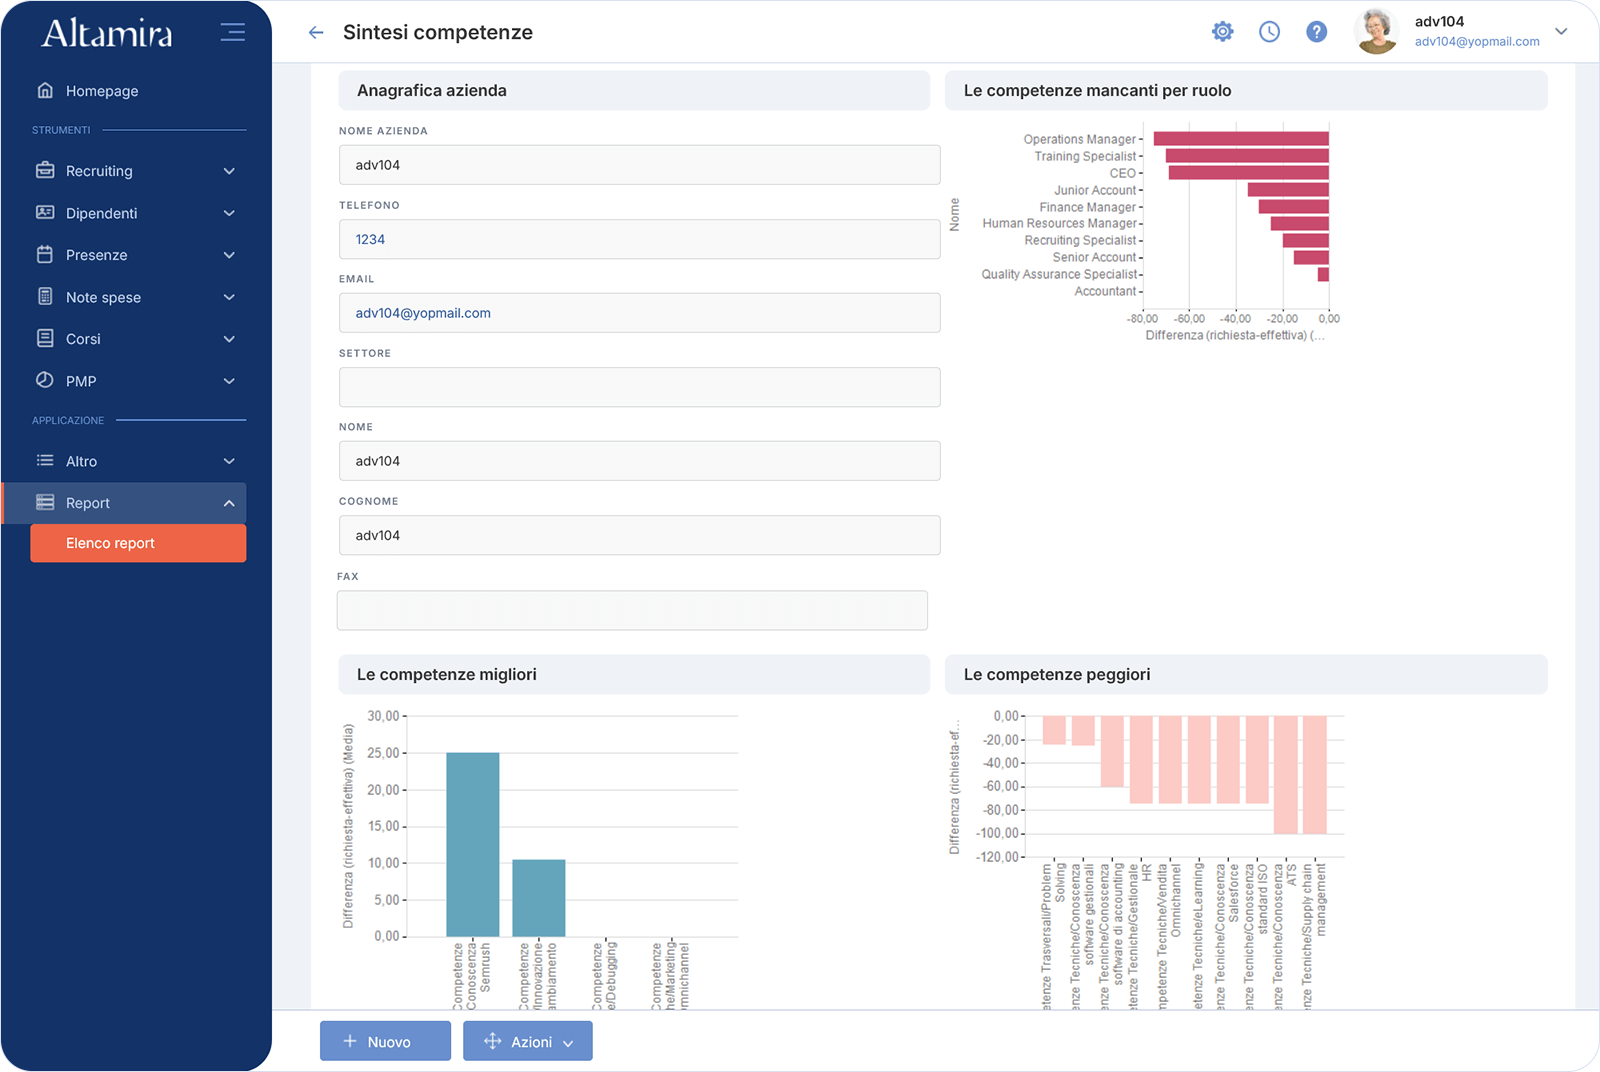
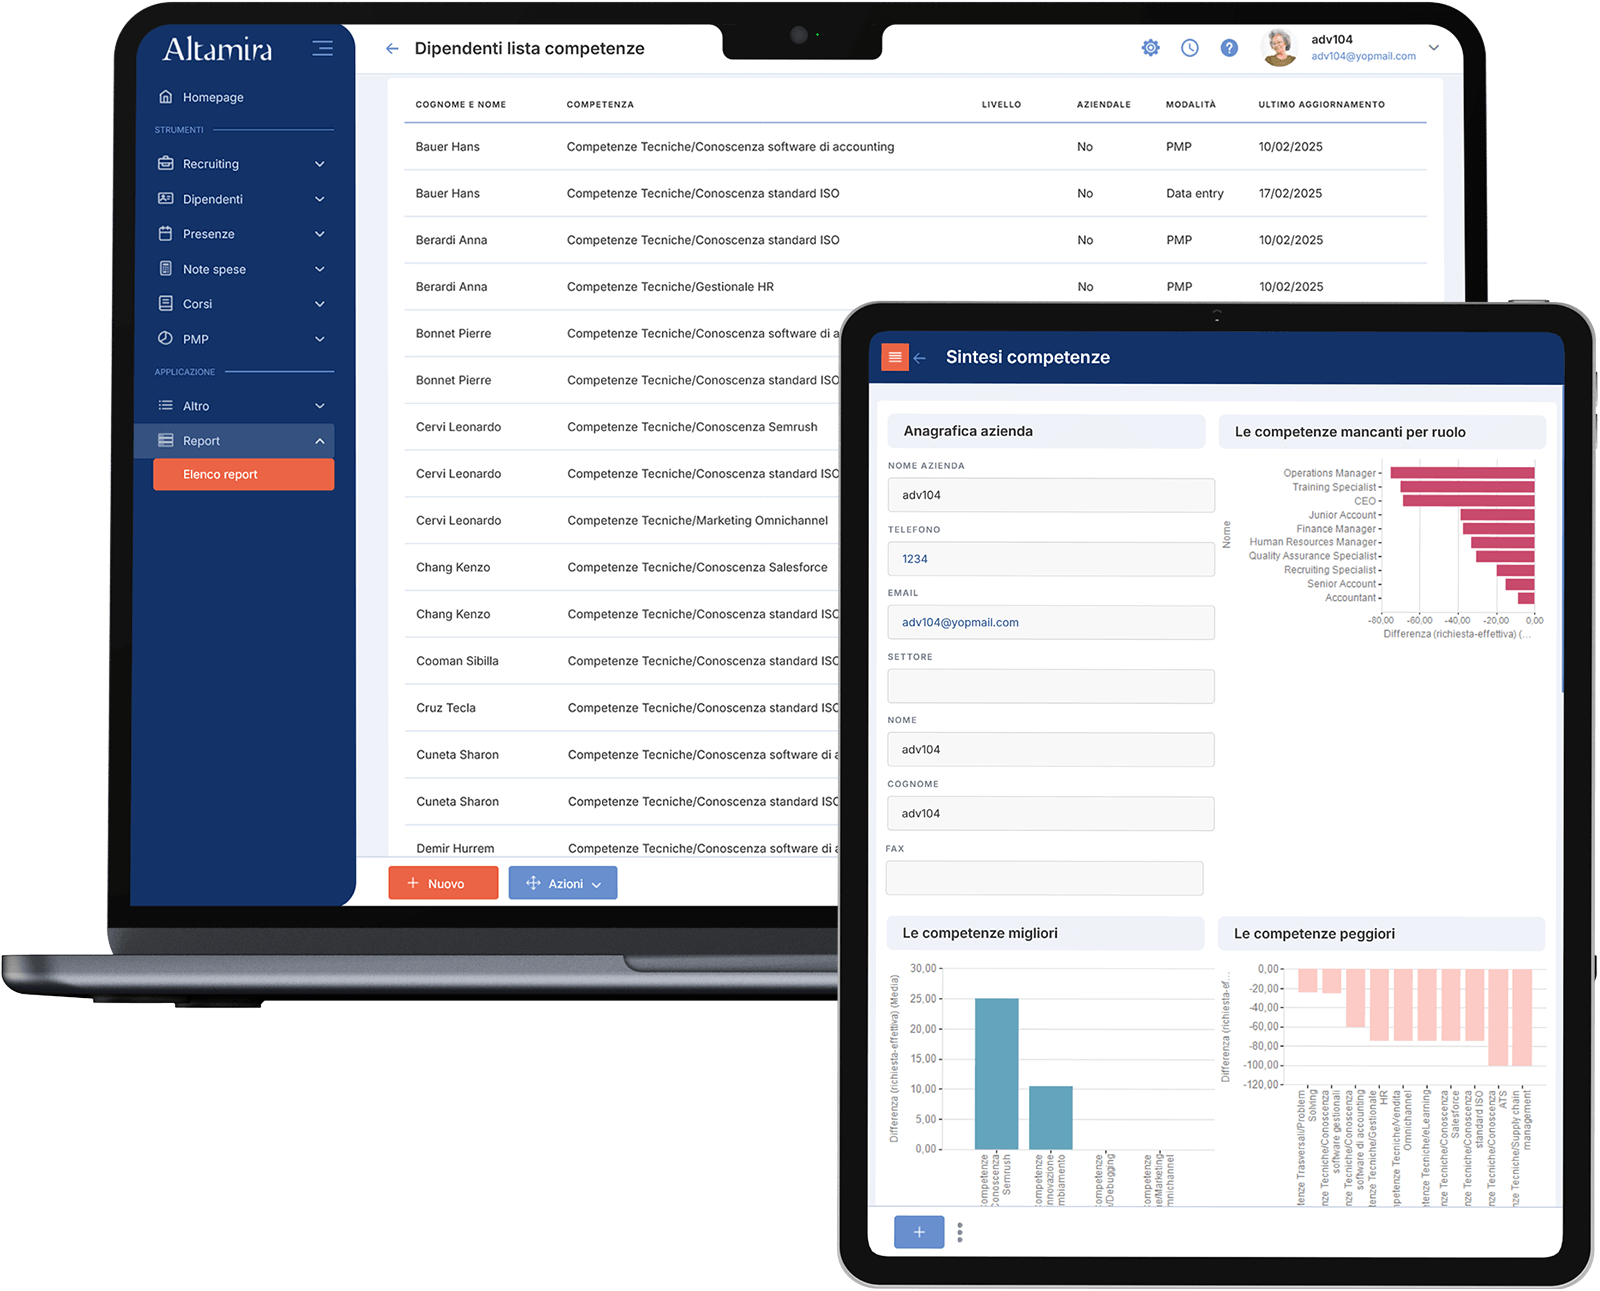
Thanks to a reporting system that is second to none, you can obtain valuable information on your current human capital in convenient charts which are easy to export and print for a business meeting.
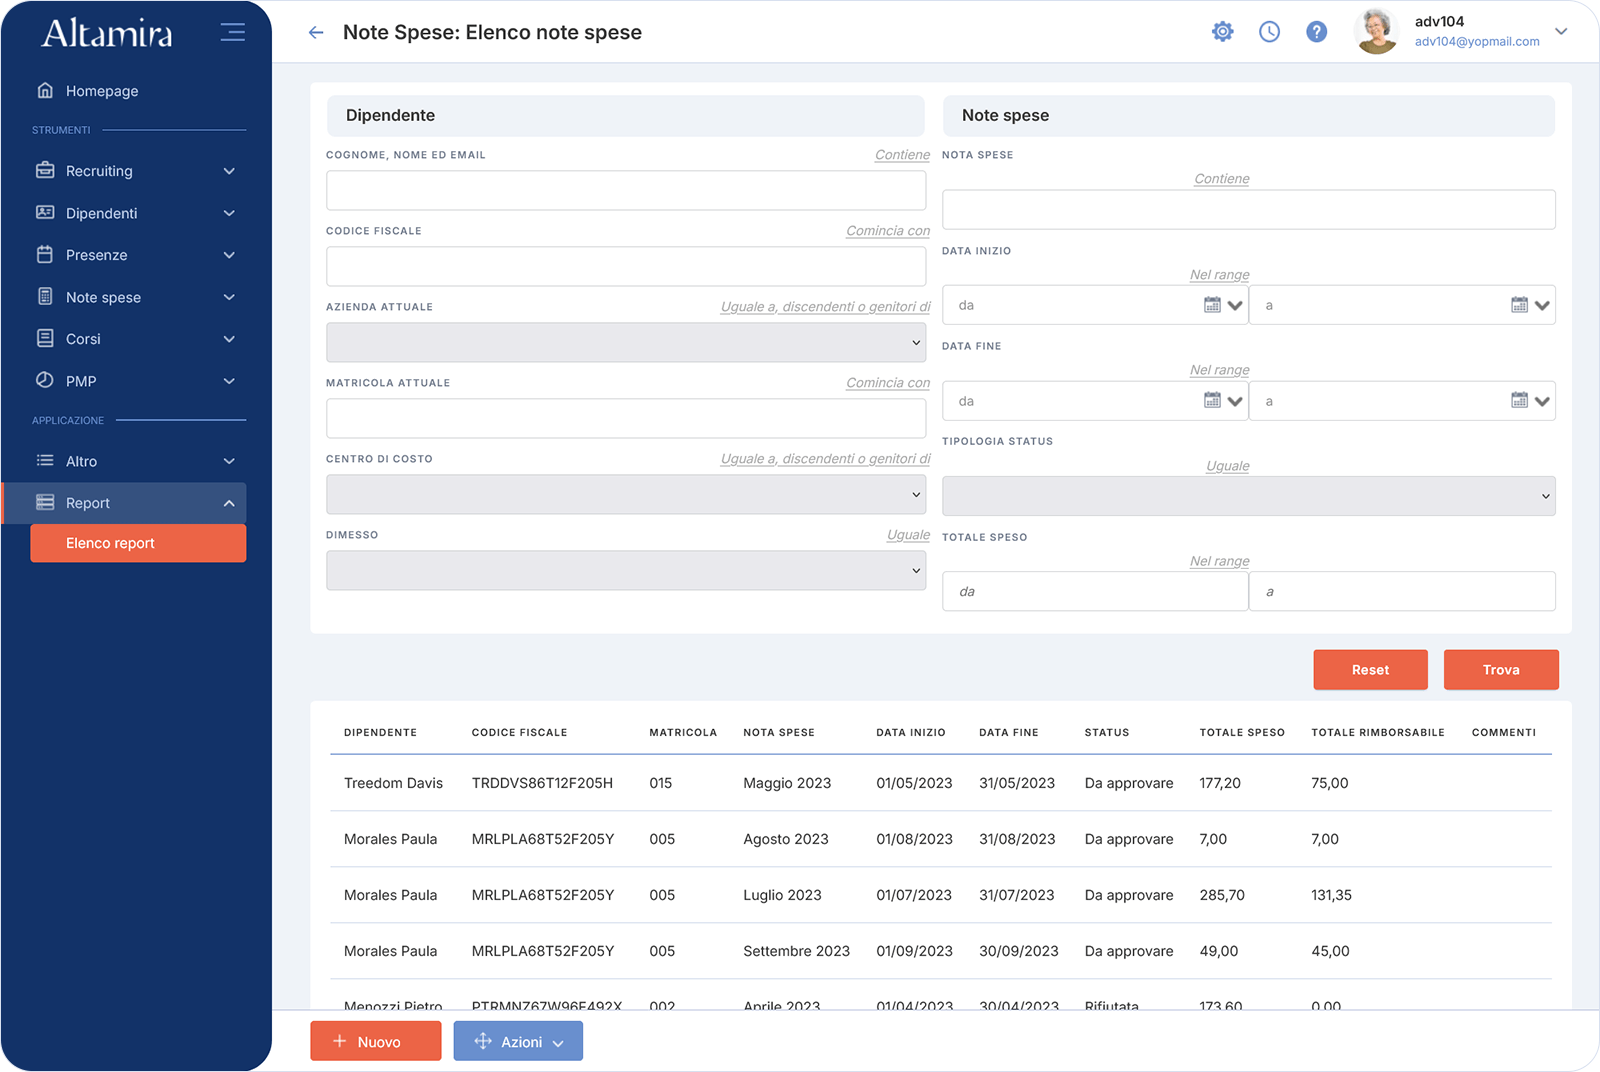
Our selection of ready-to-use reports meet a vast range of needs, from bonuses to salaries, from competencies to training courses.
The reports can provide information about the overall performance of the company or on the activities carried out by individual users.
One of the outstanding features of Altamira is that it allows you to customize everything, including reports. This means that companies using our platform are sure of being able to document every activity they use it for.
With our designer, you are completely free to create as many new reports as you wish. Starting from the library of existing reports, apply your chosen parameters to all available data and choose the form of graphical representation that best suits you.
Using the designer is easy: simply click and drag to add and remove fields; no technical knowledge required.
Does your company already use multiple software to manage human resources and other company matters?
Altamira Employees offers its services as the nerve centre for all activities, because it can be easily integrated with other applications and can import the data you want, making this visible in fields you set up yourself.
The imported data in Altamira can be analyzed in exactly the same way as the information generated by the platform itself. You can then combine and view all the key metrics of your human capital.
For your reports, you have a wide range of tables and charts to choose from: Cartesian graphs, histograms, pie charts, radars, and many other types of diagram.
The use of charts enables you to organize and display the data in a clear and intuitive manner so as to identify trends, anomalies and opportunities.
You can also present information in a printable version, in which it is easy to combine charts and tables to create impressive and easy to understand reports.